Previous year questions give guidance to us and provide a base for the preparation of any competitive exam. It is always good to have an experience of how the level of exam varies from year to year. For every subject like in Quantitative Aptitude, we come to know the pattern of questions must be followed to prepare the examination.
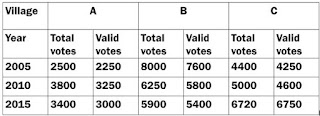
Ques 1: Study the following graph carefully and answer the question given below :
1.1. Total votes of village A in year 2005 is approximately what percent of valid votes of village C in year 2010 ?
a. 54.34%
b. 34.54%
c. 58.34%
d. 64.56%
e. 16.67%
1.2. If total votes polled in village B in year 2005 ,25% polled by females and total valid-female-votes are 1875 then find the number of valid votes polled by males ?
a. 1875
b. 5725
c. 2000
d. 6000
e. 7600
1.3. Valid votes polled in village C in 2010 is by what percent less than total votes polled in village B in 2005?
a. 42.50%
b. 45%
c. 43.50%
d. 63.50%
e. None of these
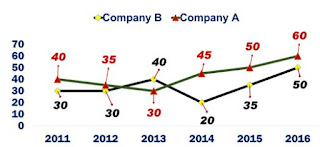
Ques 2: Percent profit earned by two companies over the given years:
a. 240
b. 250
c. 260
d. 280
e. 210
2.2. If the Income of two companies in 2012 were equal , what was the ratio of their Expenditures ?
a. 26 : 27
b. 37 : 26
c. 27 : 26
d. 3 : 2
e. 7 : 5
Answers:
Ans 1.1: (a) 54.34%
Total votes in village A in year 2005 = 2500
Valid votes of village C in year 2010 = 4600
Ans 1.2: (b) 5725
8000 total votes
Female = 2000
Male = 6000
Valid votes = 7600
Female = 1875
Male = 5725
Ans 1.3: (a) 42.50%
Valid votes in village C in year 2010 = 4600
Total votes of village B in year 2005 = 8000
Ans 2.1: (a) 240
Ans 2.2: (a) 26 : 27


